
Ethereum is the second biggest cryptocurrency. Many people call it ETH. As of February 9, 2026, the price sits around $2,090. It has dropped a lot recently. From highs near $3,300, it fell over 30% in weeks. Big liquidations happened. Fear is high in the market. Some experts look at charts and data. They see more downside. A drop to $1,400 could happen if things get worse.
Recent Price Action: A Sharp Drop
ETH started 2026 strong. But February brought pain. The price crashed fast. On some days, it fell 10% or more. Leverage played a role. Many traders got liquidated. Over $1 billion in positions closed. This made the drop worse.
Now, ETH tries to hold above $2,000. But buyers are weak. Sellers control the market. A rebound happened a bit. Yet, the trend looks down.
Ethereum Plunges Below $2,000 as Whale Accumulation Battles Mid …
Technical Indicators Flash Bearish Signals
Charts show warning signs. Many indicators point down.
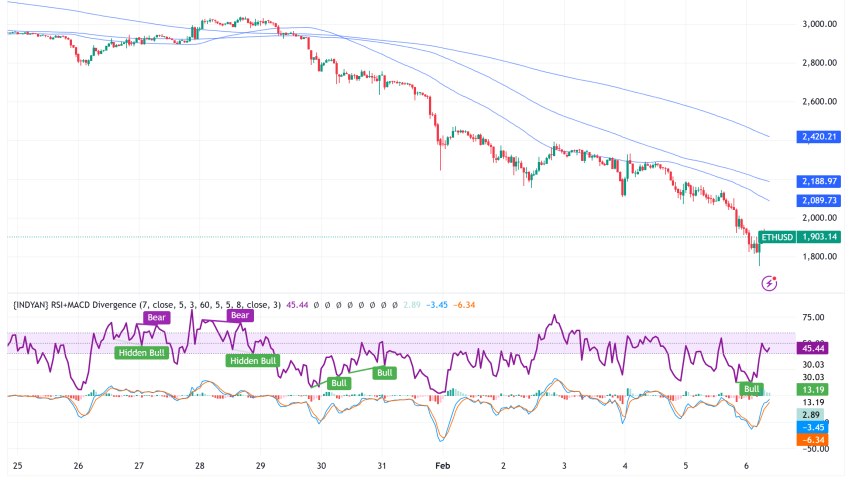
First, the RSI. It is low. This means oversold. But in downtrends, it can stay low. No quick bounce guaranteed.
Next, MACD. It shows bearish crossover. Momentum is negative.
Moving averages are bad too. The price is below key ones like 50-day and 200-day. Death cross happened earlier.
Patterns look scary. Some see double top. Others spot symmetrical triangle breakdown. Head and shoulders too. These often lead to lower prices.
Support levels are key. Current one near $1,900-$2,000. If it breaks, next is $1,800. Then lower to $1,400-$1,650. Some charts even show $1,400 as possible target.

On-Chain Data: Mixed but Worrying Signs
On-chain metrics tell more. They show what happens on the network.
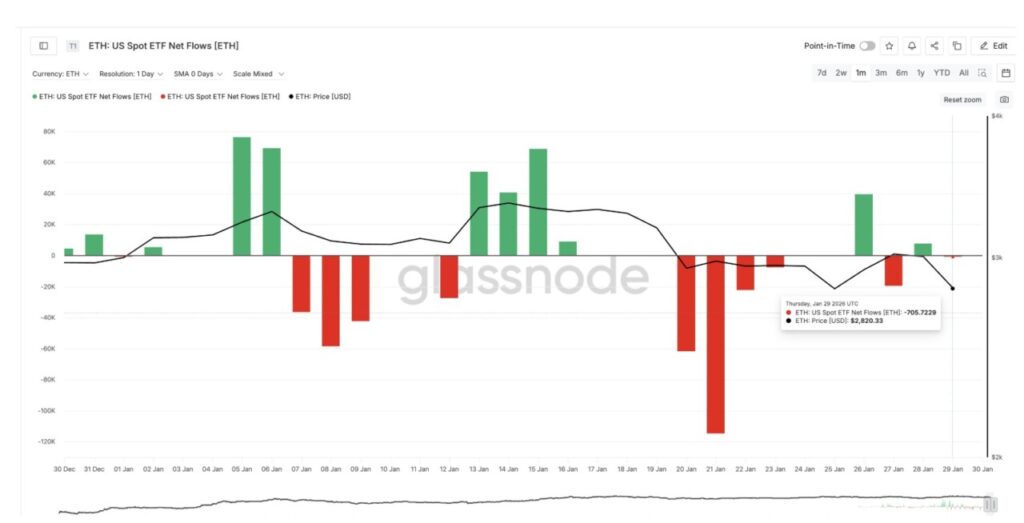
Exchange flows are negative. More ETH leaves exchanges. This can be good long-term. Holders move to wallets. But in short term, selling pressure is high.
Whale activity is quiet. Big players accumulate sometimes. But recent data shows rotation out.
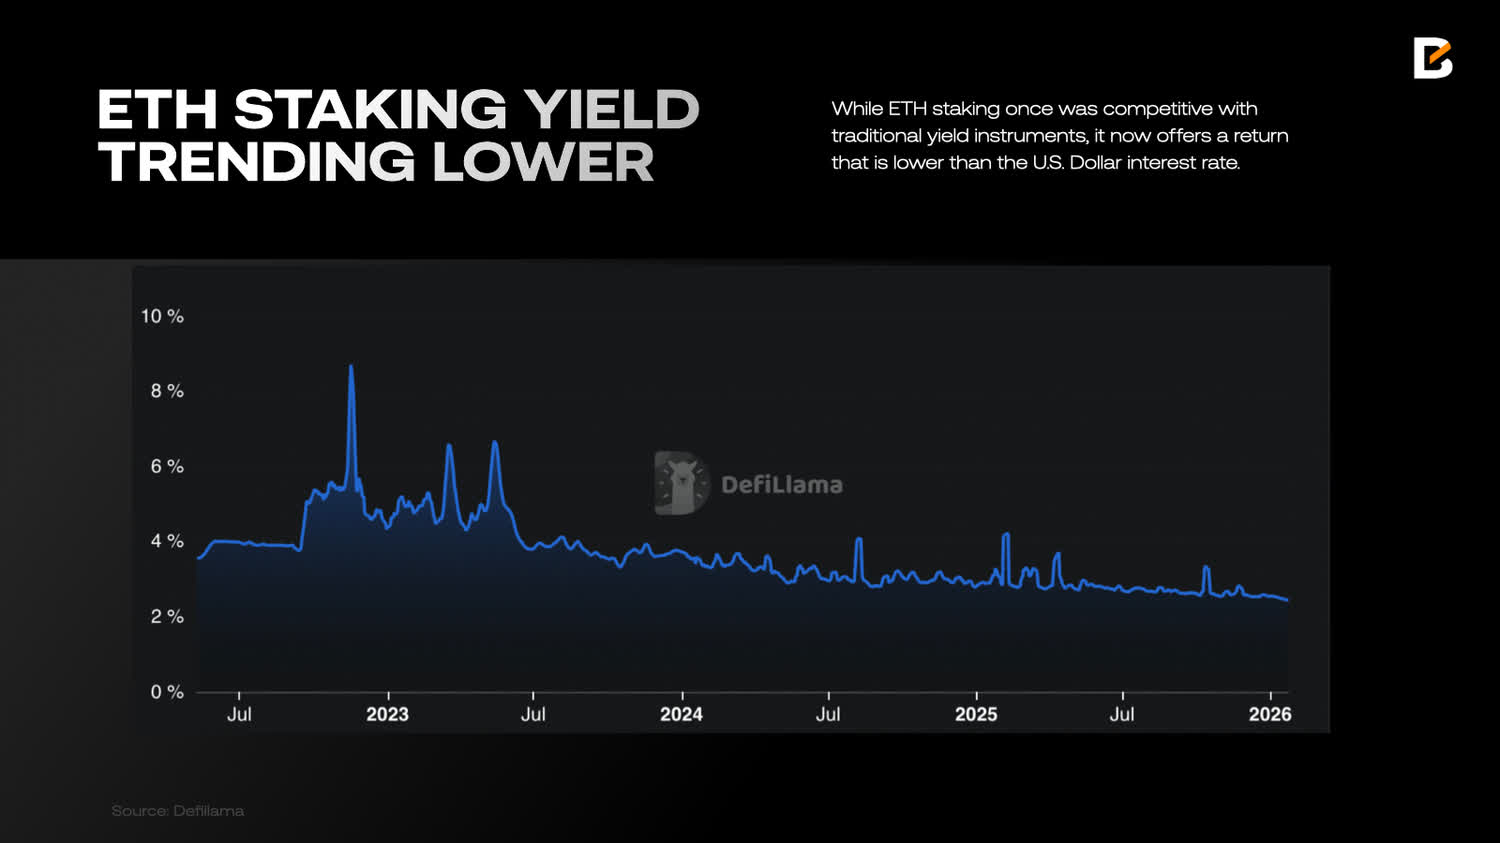
Staking is strong. Many lock ETH. Yield is lower now. Network use dropped a bit after highs.
Transactions were high earlier in 2026. Now slower. Fear index is extreme. This often marks bottoms. But not always.
Could ETH Really Hit $1,400?
Some analysts say yes. If $1,900 support fails, panic selling could come. Deviation areas go down to $1,400. Prediction markets bet on levels like $1,360 or $1,400.
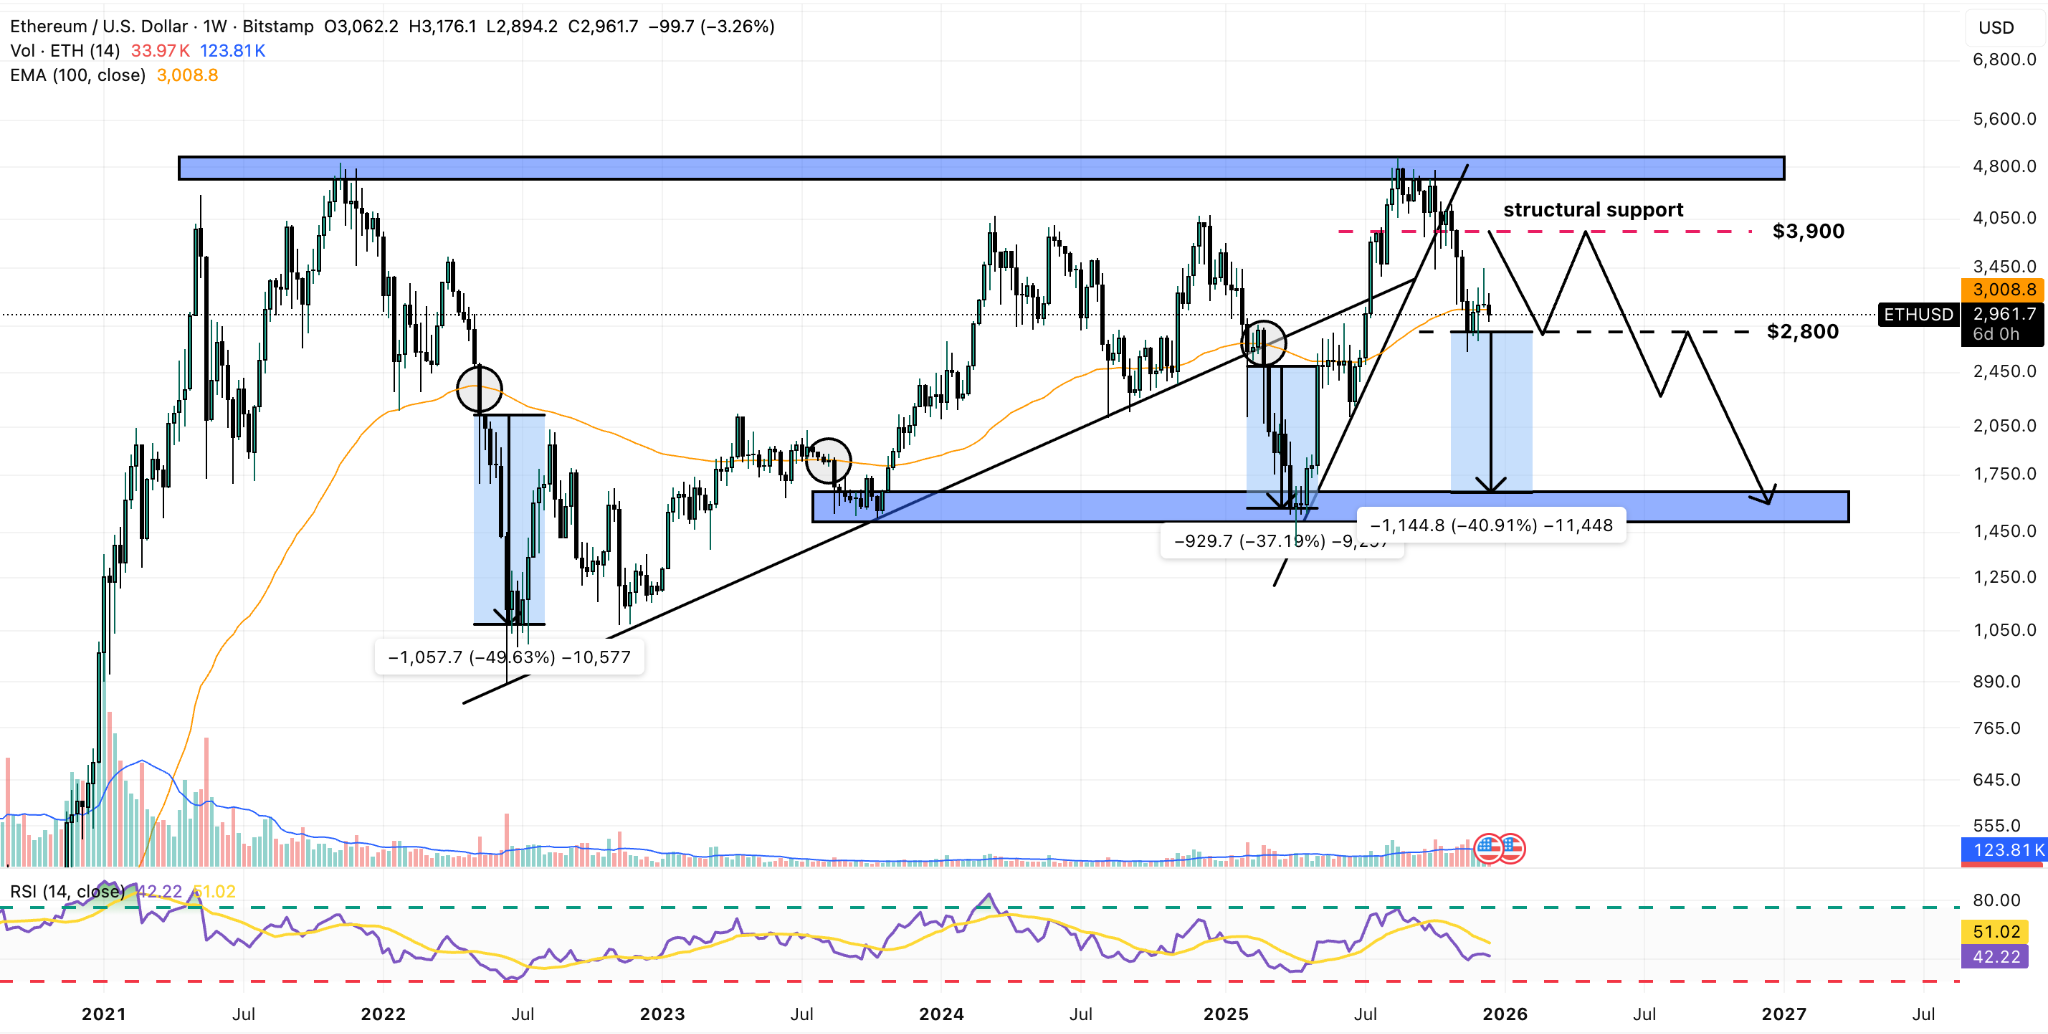
Past cycles show big drops. In bear markets, ETH fell hard. Current setup looks similar.
But not everyone agrees. Some see bottom near $1,800. Demand zone there. A bounce to $2,500 possible if buyers step in.
Long-term, ETH has upgrades. ETFs bring money. But short-term risk is high.
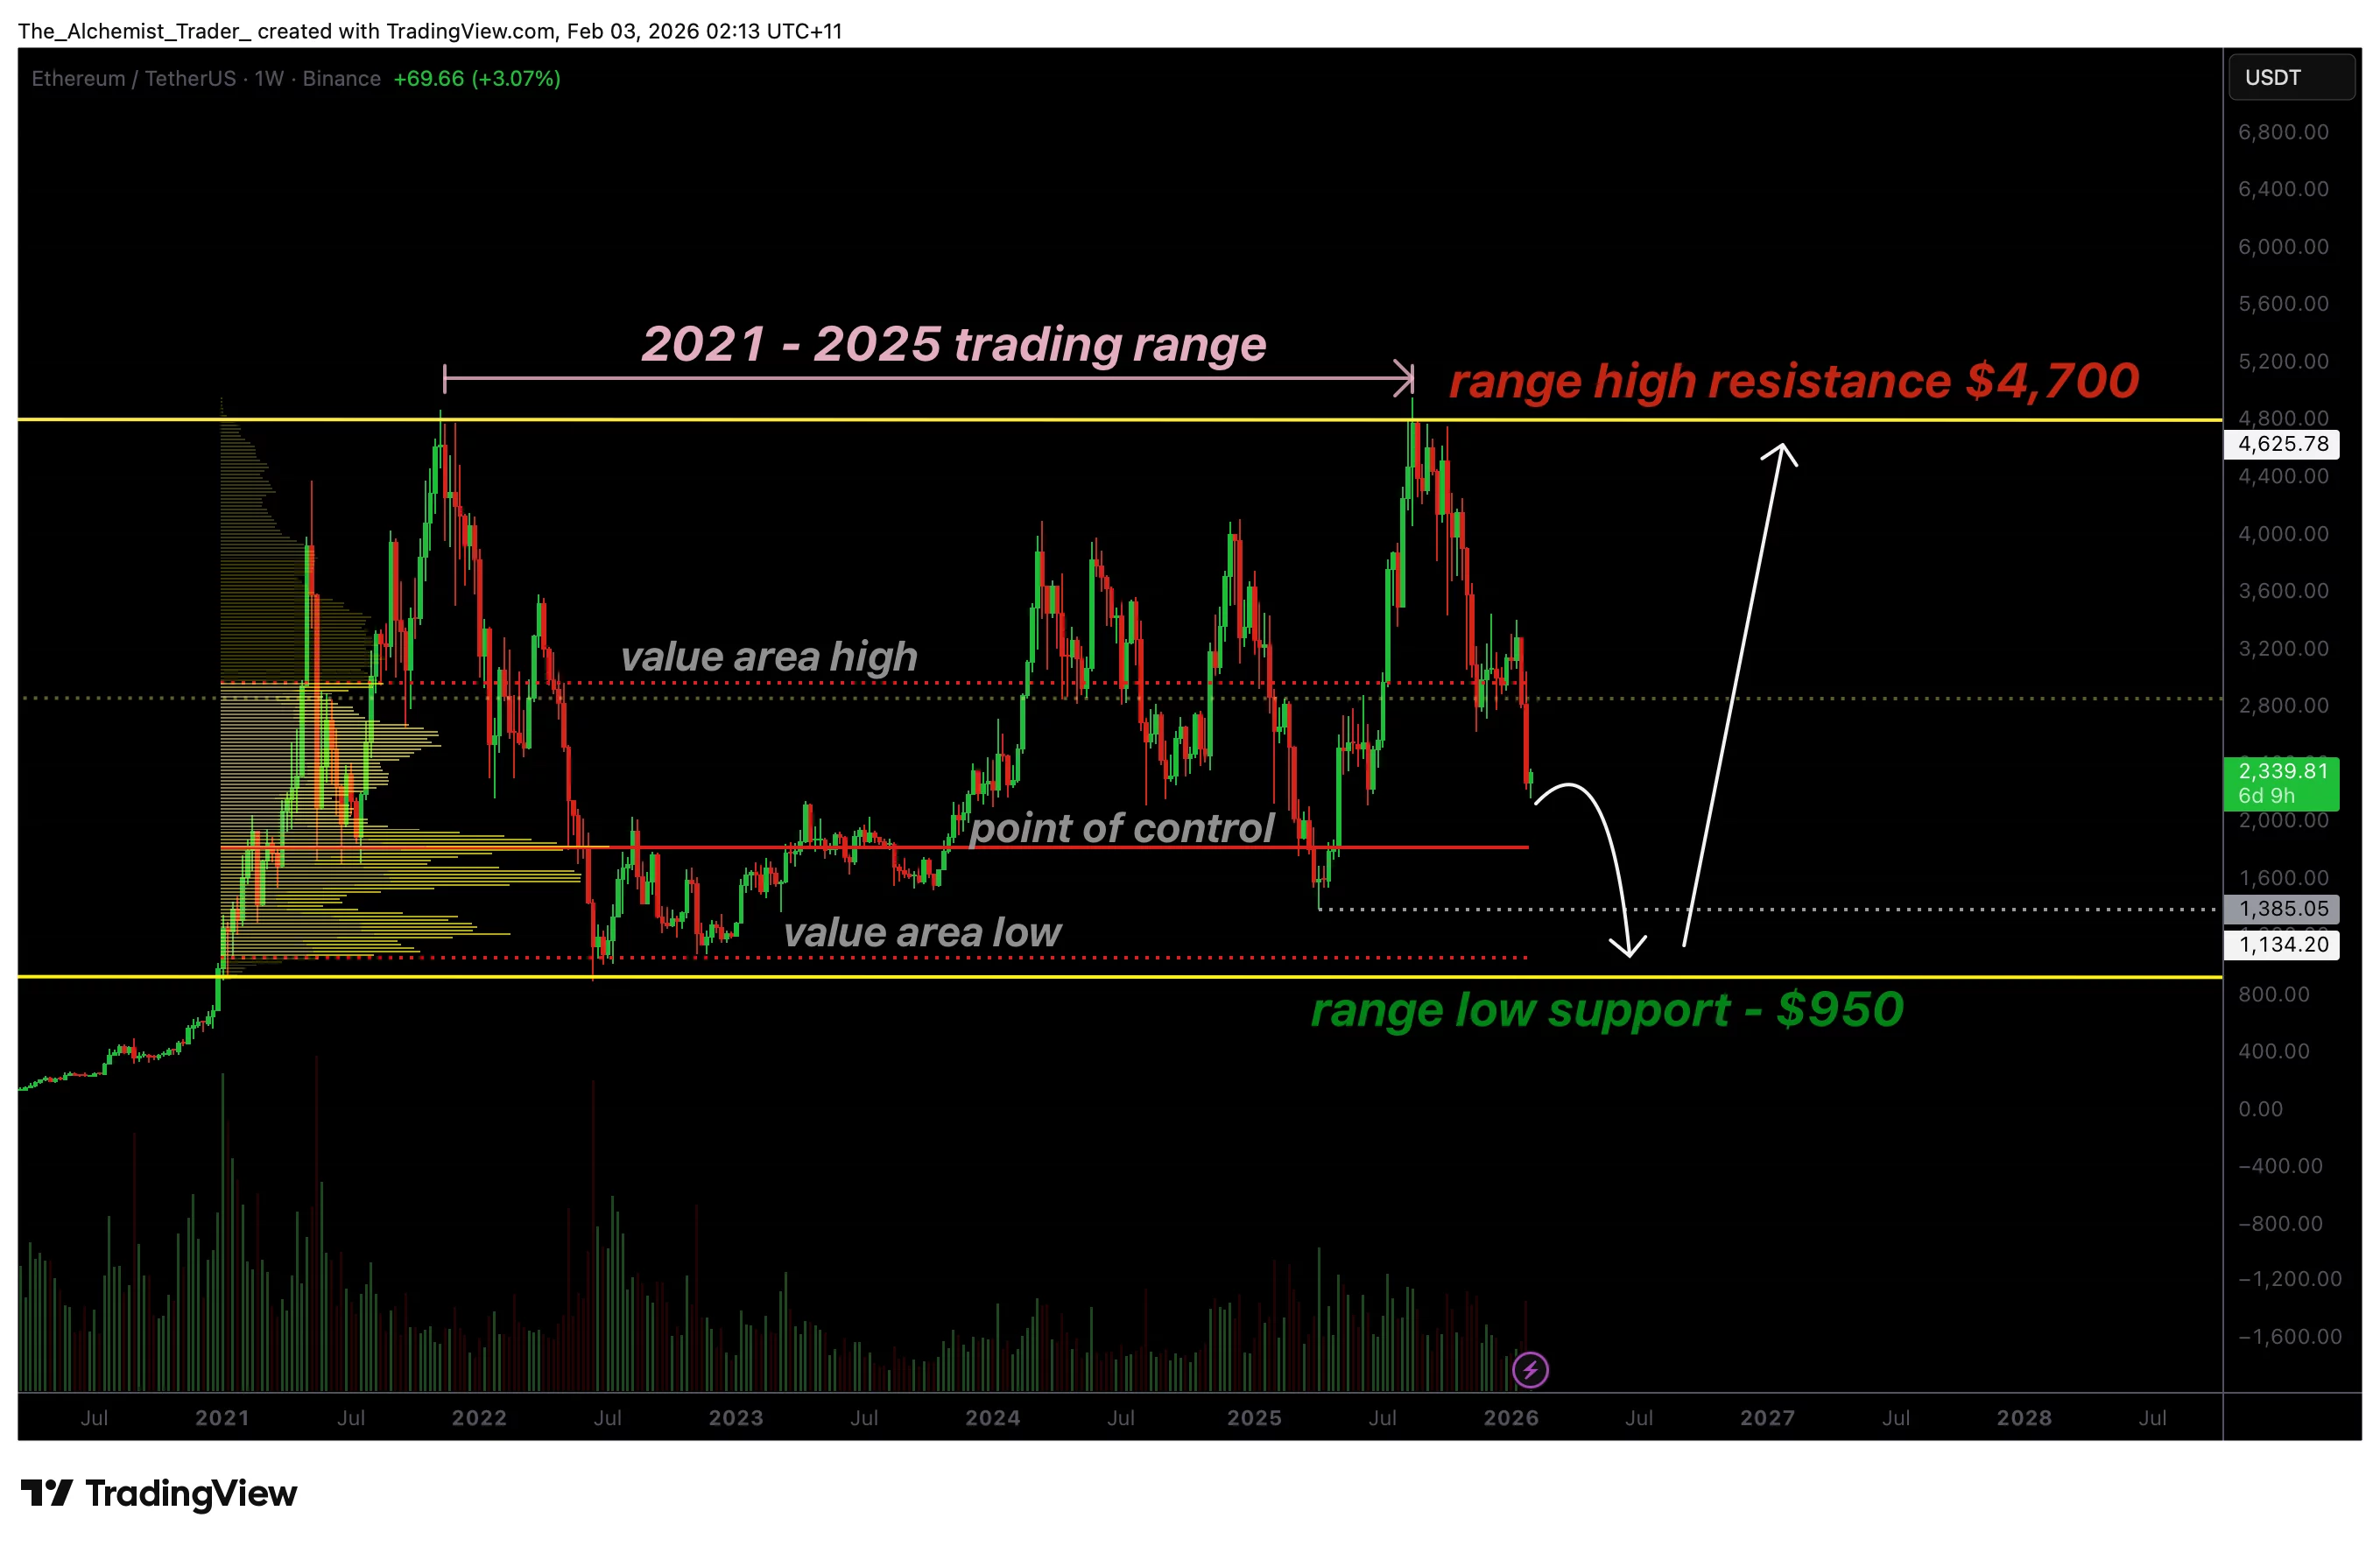
Ethereum Price Holds Five-year Range As Breakdown Risk Points To …
Honest Opinions on Ethereum Right Now
This drop hurts. It feels like a leverage flush. Markets clean out weak hands. ETH looks weak on charts. Bearish bias is clear.
A breakdown to $1,400 is possible. It would be painful. But crypto is volatile. Bottoms come with extreme fear.
I think caution is smart. Not financial advice. But if you hold, be ready for more downs. Or it could rebound fast. No one knows sure.
Long-term, Ethereum is strong. Network effects matter. But 2026 started rough.
Final Thoughts
Ethereum faces real risk today. Technical indicators are bearish. On-chain data shows pressure. A drop to $1,400 is on the table for some experts.
Watch supports closely. $2,000 first. Then lower ones.
Markets change quick. Stay updated. What do you think? Will ETH hold or break lower?